When we mix fine grained soil in large quantities of water the resulting suspension of soil is called the liquid state of soil. In this state soil exerts no resistance to flow and shear deformations. Soil flows like a liquid and it has zero shear strength.
Now water content of this suspension is reduced, the soil starts developing resistance to flow. There comes a stage when the sample changes from possessing no shear strength to possessing infinitesimal shear strength and changes from the liquid to plastic state.

Soil stops being liquid and does not flow. The water content of the soil at that stage is known as liquid limit.
We can determine liquid limit by two laboratory methods.
1. Casagrande Method
2. Cone penetration Method
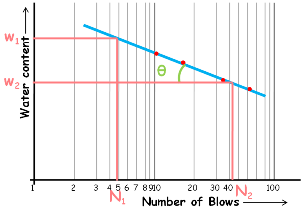
 In Casagrande Method we use an apparatus to give blows to the soils of different water contents. We plot a graph between these experimentally obtained numbers of blows and their corresponding water content. Number of blows is plotted on log scale.
A best-fitting curve is drawn through the experimental points and we observe the graph is approximately a straight line.
This curve is known as Flow Curve of soil. The slope of this curve gives us an indication about the shear strength of the soil and it is known as flow index of the soil. It is denoted as IF. Slope of this curve can be calculated by taking any two water contents w1 and w2 and their corresponding number of blows N1 and N2.
Now using this right angle triangle we can determine the tan theta and that will be the slope of this curve which is the flow index of the soil.
Slope will be equal to this

And by log rules we can write it as this.

Be it the Casagrande method or cone penetration method the flow index can be defined through both the methods.

In Casagrande method graph is water content versus number of blows while in the cone penetration method it is water content versus penetration of cone into the soil.
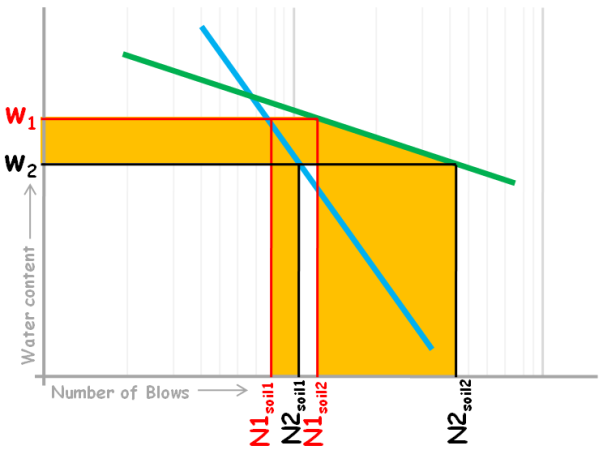
Soil with flow curve steeper will have the flow index value higher than that of the soil with the flow curve flatter.
A soil with higher value of flow index is said to possess lower shear strength than that of a soil with lower value of flow index.
We can see that by considering flow curves of these two different soils.

At water content w1 soil 1 flows at N1soil1 number of blows and soil 2 flows at N1soil2 number of blows.
Now if we slightly reduce the water content of the soils then they will gain some shear strength and now soil 1 flows at N2soil1 number of blows and soil 2 flows at N2soil2 number of blows.
It is clear that for the same amount of water content reduction soil 1 needs very less number of additional blows for it to cause flow in the casagrade cup which means that soil1 gained very little shear strength, while soil 2 needs relatively more number of blows to flow and that means soil 2 has gained more shear strength. Hence it is clear that with slight decrease in the water content soil 2 has become stiffer than soil1 and has acquired higher shear strength.
Hence using flow curve and flow index we say soil having high flow index possess low shear strength. Flow index is a measure of the rate at which a soil mass loses its shear strength with an increase in the water content.


