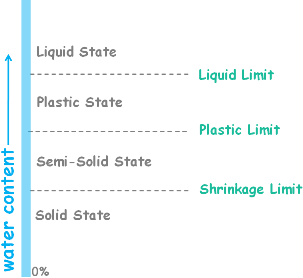
 We have learned that Consistency is a term which is used to describe the degree of firmness of soil and consistency limits are water content of soil at which the soil changes from one state to other. Those different states of soil are:
Liquid State
Plastic State
Semi Solid State and
Solid State
And consistency limits are:
Liquid Limit
Plastic Limit and
Shrinkage Limit
We learned liquid limit as the water content of the soil at which it changes its state from being liquid to plastic and stops being liquid. And also stops flowing like a liquid.
At that point shearing strength of the soil is the smallest value that can be measured in the laboratory.
The liquid limit of the soil depends upon the clay mineral present in it. Some clay minerals have larger surface area and clay particles have negatively charged surface. So greater the surface area, stronger the surface charge and greater will be the amount of absorbed water, therefore higher will be the liquid limit.
We can determine liquid limit by two laboratory methods.
1. Casagrande Method
2. Cone penetration Method
Here we will discuss casagrande’s method.
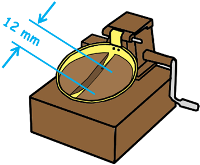
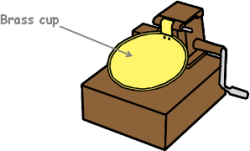 For the determination of liquid limit by this method we make use of an apparatus which is called The casagrande apparatus. It consists of brass cup which is connected so that it is in the inclined position when resting on the rubber base.
Brass cup when rotated by its handle lifts to the height of 1cm and drops freely on rubber base.
To begin with we take the soil sample and air dry it. Then we pass it through 425 micron IS sieve to get fine grained soil only. Because we know Atterberg limits are only significant for the fine grained soils.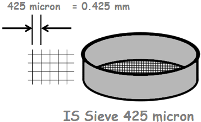 425 micron IS sieve has its mesh openings of 425 micron or 0.425 mm. The particles we get after sieving are all of size less than 0.425 mm. These particles include fine sand, silts and clays.
Then we take about 120 gm of this sieved soil in a dish and mix it with distilled water to form a uniform soil paste.
A portion of this soil paste is placed in the cup of Casagrande apparatus and the surface is smoothened and leveled.
Then a sharp groove is cut symmetrically through the sample using a standard grooving tool.
No, we do not use our finger as the standard tool.
But there are two types of standard grooving tools available.
One is Casagrande tool
and other is ASTM tool
This is Casagrande Tool. And this is how the soil profile will look like when the groove is cut.
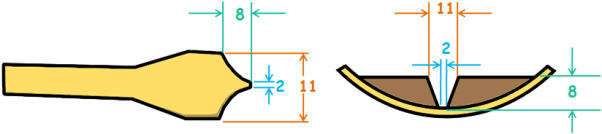
This tool cuts the groove of width 2 mm at the bottom and 11 mm at the top and 8 mm deep.
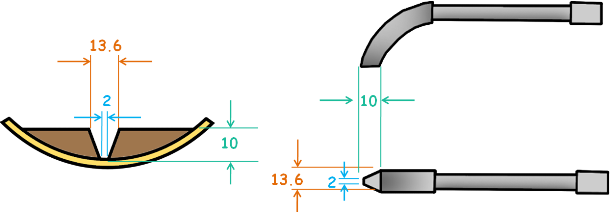
ASTM tool cuts the groove of width 2 mm at the bottom, 13.6 mm at the top and 10 mm deep.
The Casagrande tool is recommended for normal fine grained soils.
After the soil pat has been cut the handle of the apparatus is turned at a rate of 2 revolutions per second, which applies blows to the grooved soil pat. And due to which two halves of the soil pat comes into contact. And when the contact length of 12 mm is achieved we stop turning the handle.
We should take care that the groove should close by flow of soil not by slippage of it. And if slippage occurs then we should discard that soil pat and re-do the whole procedure.
This contact distance of two soil halves is measured with a ruler.
 The number of blows required to close the groove for the length of 12 mm is noted as N1.
About 10 gm of soil near the closed groove is taken for the water content determination. Water content is determined using any of the water content determination methods. Determined water content is noted as W1.
The liquid limit has been defined as the water content of the soil at which the groove closes to 12 mm in 25 number of blows.
That means our observation of water content w1 could be the liquid limit of our soil sample if number of blows given to soil sample N1 was 25.
But practically, it is difficult to get exactly 25 blows for the 12 mm groove closure, so we conduct the test for different water contents so as to get the number of blows in the range of 10 to 40.
Hence the experiment is repeated three more times after adding more water to the soil and each time recording the number of blows to close the groove for a distance of 12 mm and determining the corresponding water content.
Soil with low water content would yield more number of blows as the soil paste will be stiffer and soil with higher water content would yield less number of blows.
We plot a graph between these experimentally obtained values of number of blows and their corresponding water content. Number of blows are plotted on log scale.
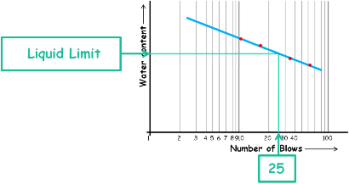 A best-fitting curve is drawn through the experimental points. And we will observe the graph will be approximately a straight line. This curve is known as Flow Curve of soil.
The water content corresponding to 25 blows is read from the graph (flow curve) and is taken as the liquid limit.
The liquid limit is expressed as the nearest whole number.
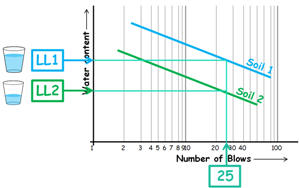
Now let’s look at the flow curve of two different soils. If we draw a line from 25 numbers of blows, we can see, Soil 1 would reach at liquid like state at water content LL1. And soil 2 would attain the same state at water content LL2. Clearly LL1 is higher than LL2.
Soil 2 has liquid limit value less than that of soil 1. Soil 2 will become and behave like a liquid at lower water content compared to soil 1.
In other words we can also say that if we keep on adding water to both the soils, soil 2 loses its shear strength and becomes liquid like earlier at lower water content than soil 1.
Liquid limit of soil can also be determined by another method called Cone penetration method.