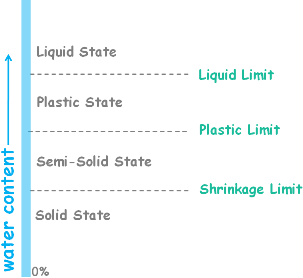
 We have learned that Consistency is a term which is used to describe the degree of firmness of soil and consistency limits are water content of soil at which the soil changes from one state to other. Those different states of soil are:
Liquid State
Plastic State
Semi Solid State and
Solid State
And consistency limits are:
Liquid Limit
Plastic Limit
and Shrinkage Limit
We learned liquid limit as the water content of the soil at which it changes its state from being liquid to plastic and stops being liquid, and stops flowing like a liquid.
At that point shearing strength of the soil is the smallest value that can be measured in the laboratory.
The liquid limit of the soil depends upon the clay minerals present in it. Some clay minerals have larger surface area and clay particles have negatively charged surface. So greater the surface area, stronger the surface charge and greater will be the amount of absorbed water, therefore higher will be the liquid limit.
We can determine liquid limit by two laboratory methods.
Casagrande Method
and Cone penetration Method
We have already discussed the Casagrande Method and in this video we will discuss Cone Penetration method.
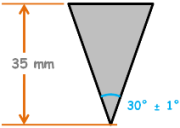
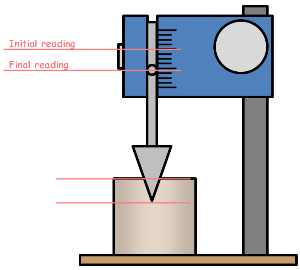
In this method we make use of an apparatus named Cone Penetrometer. It consists of a stainless steel cone which has its apex angle of 30°.
This cone has a length of 35 mm.
It is attached to the base of a steel plunger rod. Weight of this assembly is 80 gm.

This arrangement can slide vertically on pressing a push button. And it all fixed to a stand with a base by a clamping screw.
There is also a graduated scale attached to the instrument to take the readings of the amount of cone penetration.
In this test, the liquid limit is correlated to the penetration of a freely falling calibrated cone into the wet soil mass.
 The soil sample is prepared in the similar manner as we did for the Casagrande Method.
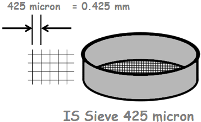
The soil sample to be used for the test is air dried, pulverized, and passed through 425 µm IS sieve. Because we know Atterberg limits are only significant for the fine grained soils.
425 micron IS sieve has its mesh openings of 425 micron or 0.425 mm. The particles we get after sieving are all of size less than 0.425 mm. These particles include fine sand, silts and clays.
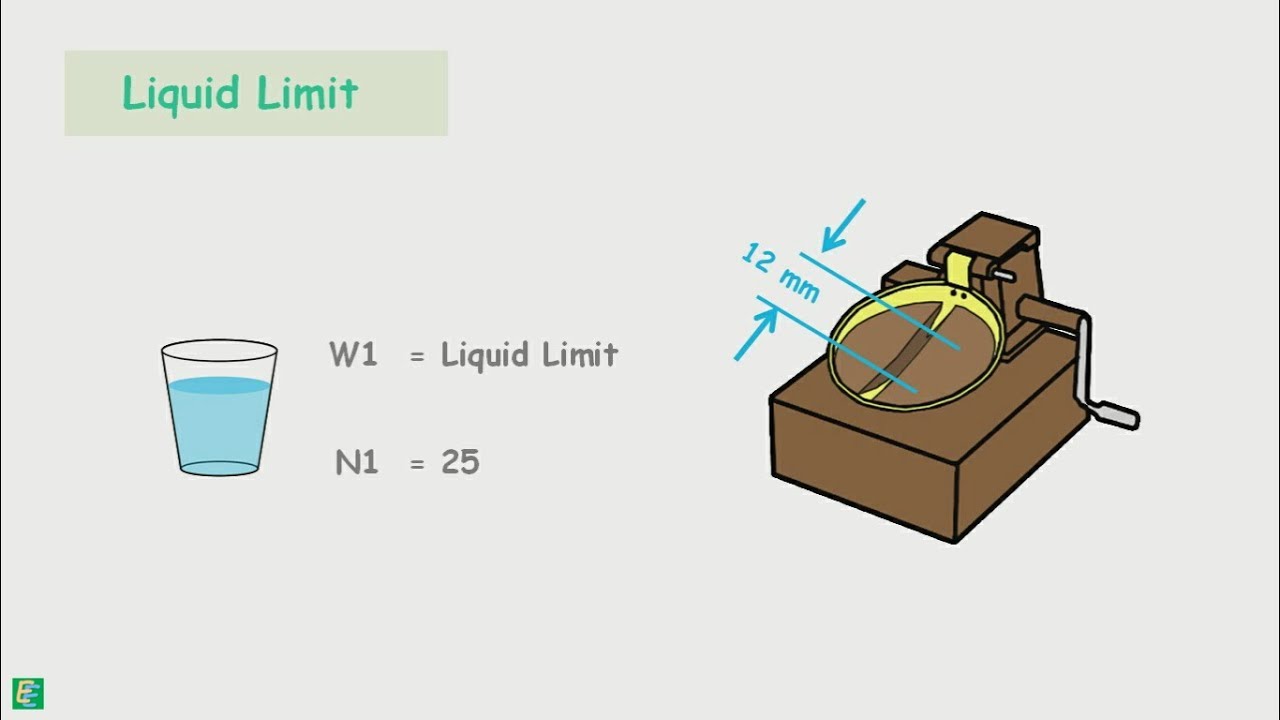
We take about 150 g of this sieved soil in evaporating dish and thoroughly mix distilled water to form a uniform paste.
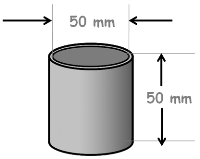
Enough amount of soil is placed in the brass cup of 50 mm internal diameter and 50 mm height. We need to ensure that no air is entrapped in the cup. Surface of the soil is levelled and the cup is placed below the cone.
The cone is gradually lowered so as to just touch the surface of the soil in the cup. On the Graduated scale reading is noted as the initial reading.
 Then, we start the timer and the push button is pressed to release the cone. The cone is allowed to penetrate the soil for 5 seconds.
After 5 seconds the reading on the graduated scale in noted down as the final reading.
The depth up to which the cone has penetrated the soil sample can be known by the difference of the initial and final reading of the scale.
The penetration is noted down to the nearest millimeter. Let’s say this penetration is P1 mm.
Some amount of soil is taken from the top of the cup and its water content is determined using any of the water content determination methods. Say the determined water content is W1.
Liquid limit of a particular soil is defined as the water content at which cone penetrates the soil up to 20 mm in 5 seconds
But, since it is difficult to have such a water content of soil which gets us the exact 20 mm of penetration in 5 seconds, we repeat the whole procedure at least three more times with different water contents.
The remaining soil in the cup is removed and mixed in the dish again. The cup and the cone are cleaned.
Now we add more water to the soil, and again make a uniform paste. Then we repeat the experiment and the values of penetration (P2, P3, P4) and their corresponding water contents (W2, W3, W4) are determined.
Soil with low water content would yield less penetration value as the soil paste will be stiffer and soil with higher water content would yield higher penetration value.

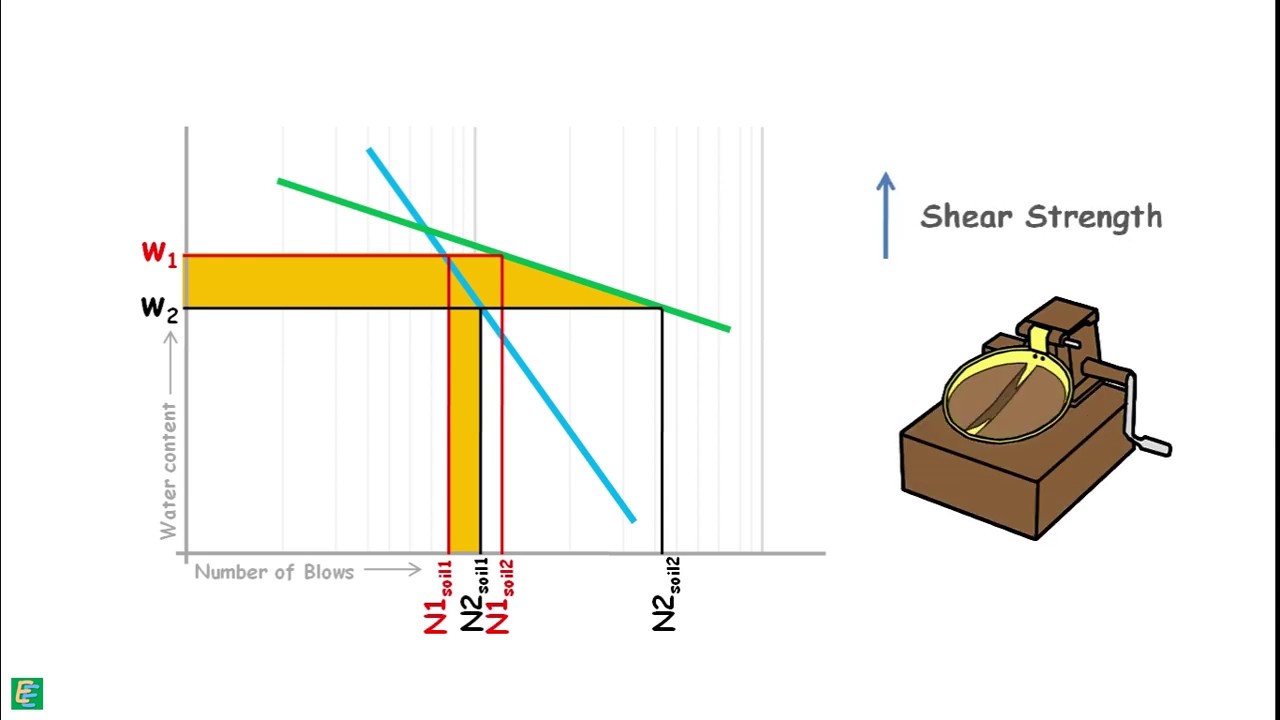
Using these values we plot a graph. Water content is plotted on normal scale and penetration is plotted on log scale. A best-fitting line is drawn through these experimental points.
Now from this graph the water content value corresponding to 20 mm of cone penetration is read and that value is taken as the liquid limit of that soil.
The liquid limit is expressed as the nearest whole number.

Let’s look at the curves of two different soils. We can observe Soil 1 would reach at liquid like state at water content LL1. And Soil 2 would attain that state at water content LL2.
Clearly water content LL1 is higher than LL2.
We can also say that soil 2 loses its shear strength and becomes liquid like at lower water content than soil 1 does.
When the water content of the soil falls below liquid limit, soil enters into the plastic state.
Hi just wanted to give you a brief heads up and let you
know a few of the pictures aren’t loading correctly.
I’m not sure why but I think its a linking issue.
I’ve tried it in two different browsers and both show the same
results.
Thanks for your feedback. The problem has been fixed now.