To understand the engineering behavior of the soil we employ numerous methods and particle size distribution is one of them.
 Particle size distribution is the method of separation of any soil sample into different fractions based on their particles sizes.
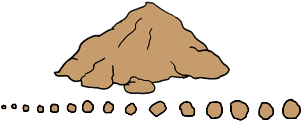
There is little possibility that a soil is composed of all the particles of just one size.
 In usual situations soil mass consists of particles of many different sizes. Particles’ size range may vary from coarse to fine in just one sample.
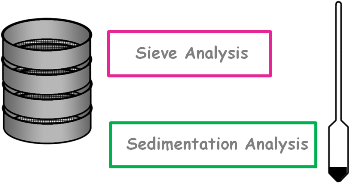
In that case to obtain particle size distribution of that sample a combined of sieve analysis and sedimentation analysis is done.
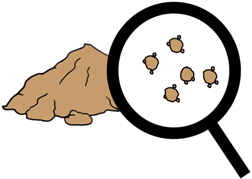 We know that very fine particles which have size smaller than 75 micron carry charges on their surface and have the tendency to stick to the other particles.
So in soil sample these smaller particles remain stuck to the other large particles.
Hence first we separate these smaller particles from large particles and for that we carry out wet sieve analysis with the sample.
The sample is first washed over the 75 µ sieve to remove the fine particles sticking to the coarse particles.
The wet soil retained on the 75 µ sieve is dried in an oven and after drying the dry sieve analysis is carried out in the usual manner.
And the finer fraction, which passed 75 micron sieve, is utilized for the sedimentation analysis using hydrometer method. Using all these methods we calculate percentage finer than different particle sizes on the basis of total mass initially taken.
Then we plot a graph between obtained percentage finer than D and the diameter of the particle D. This curve is obtained from the percentage finer results of both coarse and fine grained portions of the soil that is it results from both sieve and hydrometer analysis.
This curve is known as particle size distribution curve. It is also called Gradation curve.
The distribution of particles of different sizes in soil mass is called grading of soil.
Soil gradation is generally the classification of coarse grained soils based on the different particle sizes contained in the soil.
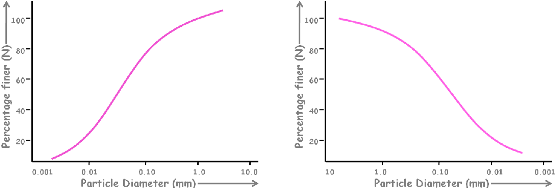
Gradation curve is represented in two ways.
In one type of graph particle size increases from left to right and in the other one particle size decreases from left to right.
Both the representations are used as per convenience. Whenever we observe the gradation curve we should be careful about the horizontal scale opted.
One more thing is to note here is that the size of the grains is plotted on log scale because range of the particle sizes is very very large. It will be very difficult to plot this range on the normal scale.
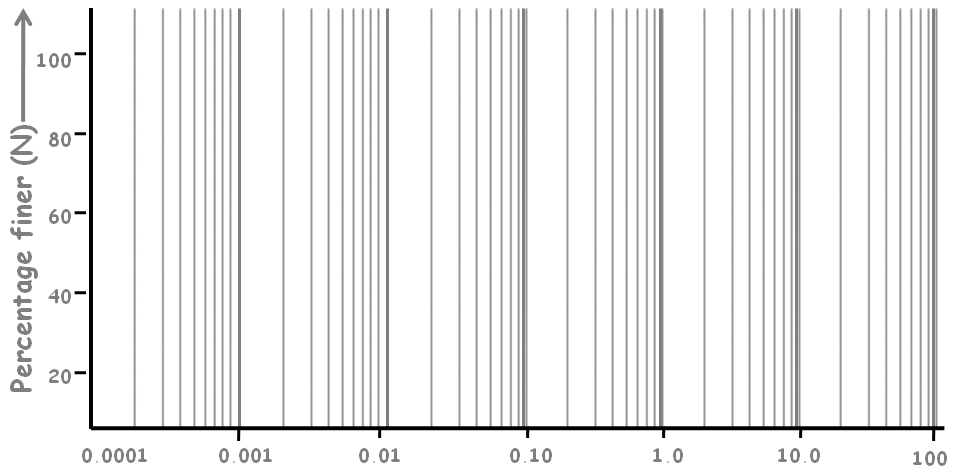
Using log scale we can represent the whole range of particle sizes in just one graph. All the particle ranges in one graph.
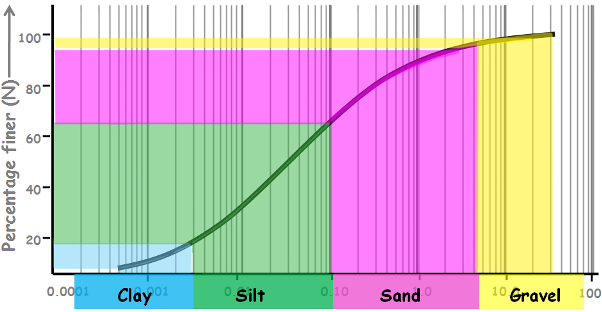
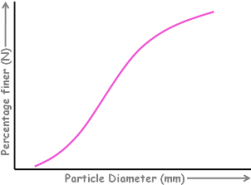
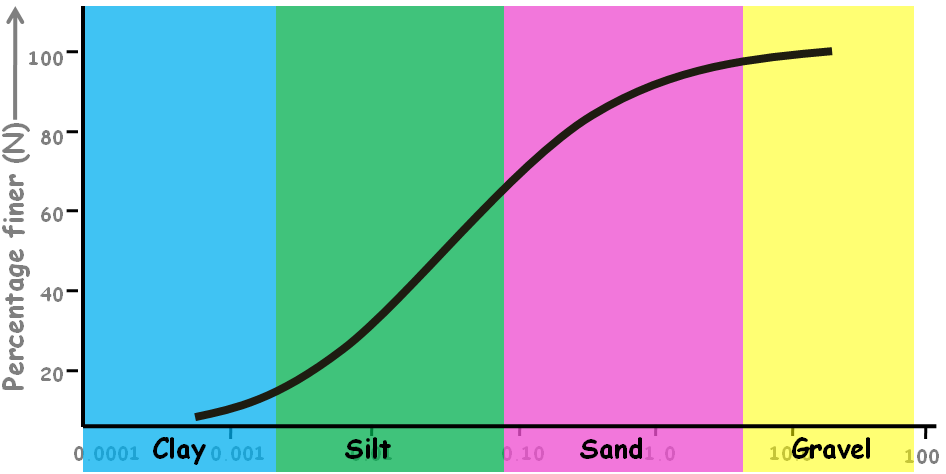
This is a typical grading curve.
There can be many others of different shapes. Each curve represents the different soil’s gradation.
So we calculated all those percentage finers to create this graph so what is the use of it. Why do we plot these curves?
Well by looking at the gradation curve we can estimate many of the soils properties.
We can know the type of soil, whether it is gravel, sand or silty soil.
The position, the shape and the slope of a curve also indicate the type and gradation of the soil.
So let’s talk about this curve.
This curve covers a wide range of particle sizes ranging from gravel to fines.
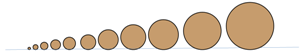
 If we take any two particle sizes on the graph scale and try to determine the amount of soil present in between, we will always get some value, no matter what are those particle sizes. This shows that this particular soil graph represents a soil which contains almost all the particles of different sizes. That is why this curve is said to be representing a well graded soil.
Well means good and gradation means distribution of particles.
That is good distribution of particles that says, all the particles of different sizes are present in this soil.
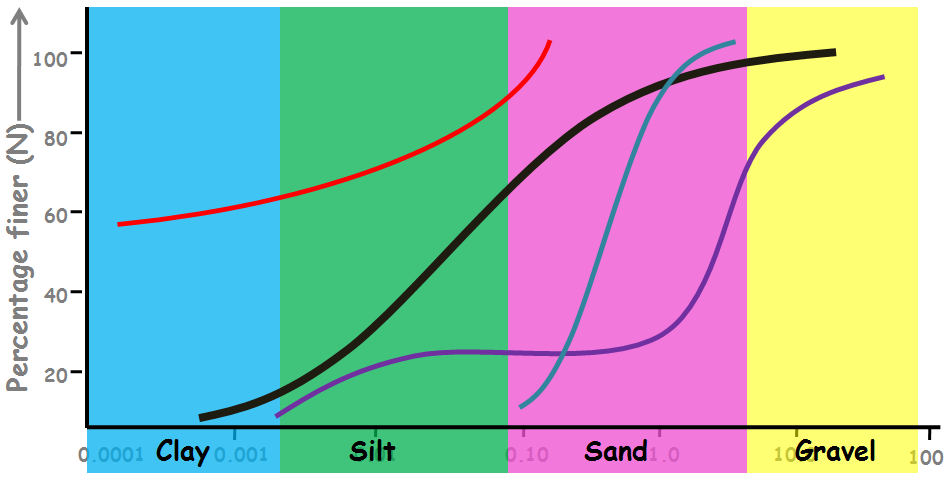
Now let’s take another curve.
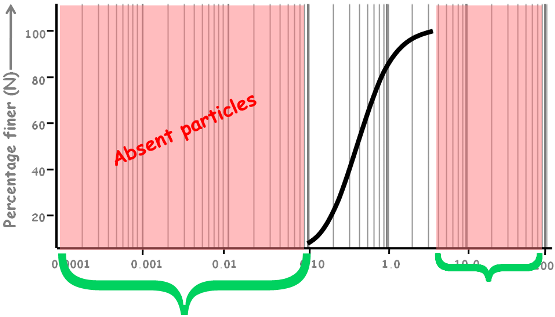
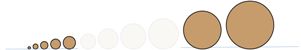
In this curve there are many particle sizes which doesn’t have their representation in the soil curve hence these sized particles are not present in the soil sample.
This clearly shows that this soil sample does not have a good representation of all particle sizes. Hence this curve is said to be representing a poorly graded soil.

A poorly graded soil either has a deficiency or an excess of certain particle sizes or has most of the particles of about same size.
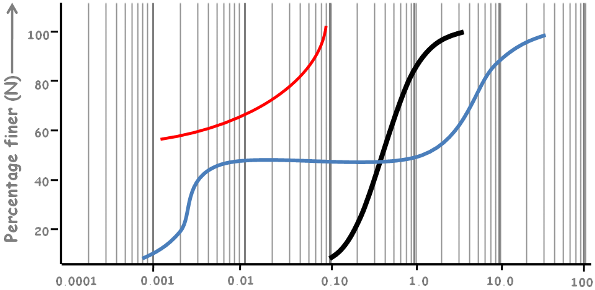
All these curves represent the poorly graded soil.
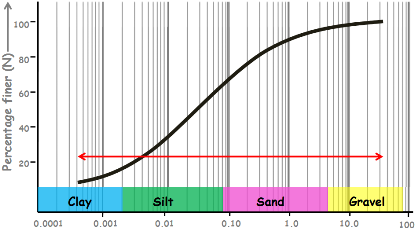
 When a soil mass contains particles of about same size, we can find it on the graph by taking any two particle sizes and see how much part of the soil is in between these two particle sizes. We will notice almost all part of the soil is between these two particle sizes.
Such soils are called uniformly graded soil.
These curves are steep and have very short range of particle sizes.
There is one more different kind of curve in which some of the particle sizes are missing in between are called gap graded.
That means there is a gap between the normal or well distribution of particles. Such soils completely miss the amount of soil between two certain particle sizes.
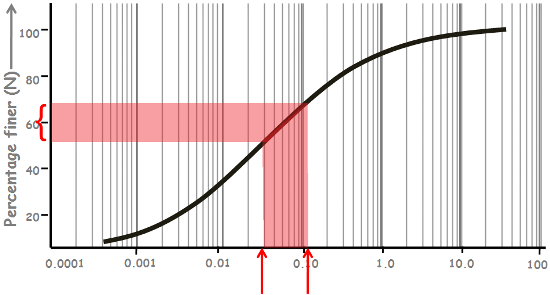
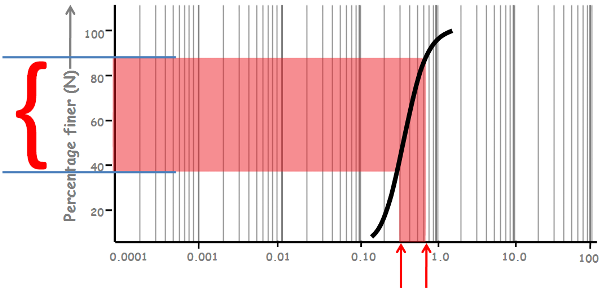
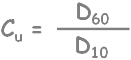
We define a parameter, mathematically, to classify the soil gradation, if it is well graded or poorly graded. This parameter is called coefficient of uniformity and it is defined as D60 divided by D10.
Here D60 is the diameter of a soil particle below which 60 percent amount of particles are finer than this size and remaining 40 percent are coarser.
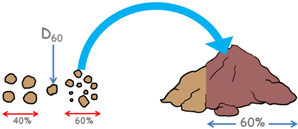 That means these particles make up the 60 percent of the soil.
D60 sized particle can be of any size and 60 percent of the soil is made up of particles of size smaller than that D60 sized particle.
In other words 60 percent of the soil mass has particles which all have size less than this D60 size.
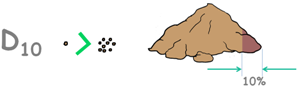 And similarly D10 is the particle size for which 10 percent amount of soil has particles which are finer than this size. This particle size D10 is called Effective Size.
If the value of uniformity coefficient is equal to the 1,
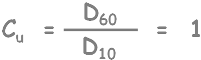
that means D60 and D10 are the same particles. In that case the whole soil mass consists of only one grain size and graph of such case will be something like this.
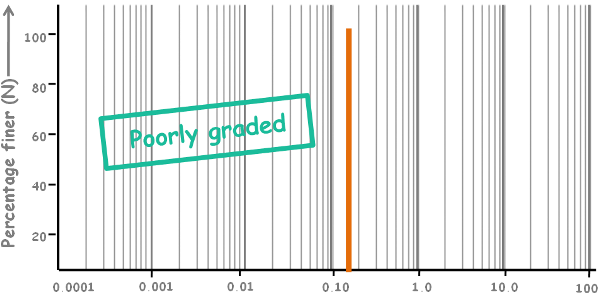
A vertical straight line. Such soils are definitely poorly graded and are called uniformly graded.
 There are few values of uniformity coefficient has been established for the gradation of soil
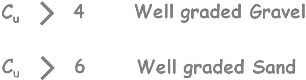
If Cu is greater than 4 then the soil is well graded gravel.
If Cu is greater than 6 then the soil is well graded sand.
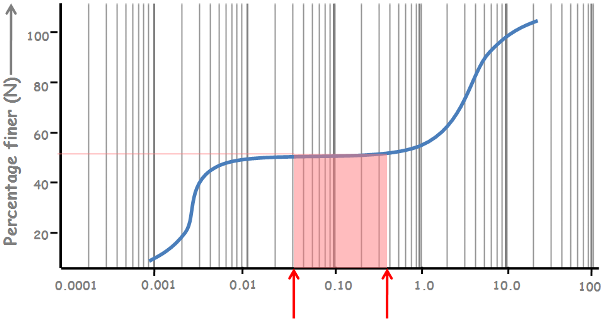
But we don’t rely on only one indicator to classify the soil gradation. Because in this curve we can have a coefficient of uniformity value as well graded because we may get D60 and D10 values distant enough to get value of this parameter large enough.
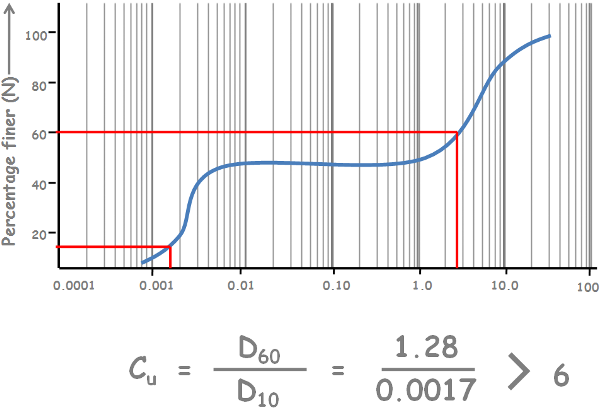
But it is clear from the graph that this soil misses a complete range of grain sizes. And we know this is a gap graded soil.
So we define another coefficient, coefficient of curvature Cc. This coefficient of curvature describes the general shape of the gradation curve.
It is defined as D30 square divided by D10 multiplied by D60.

Here D30 is the particle size for which 30 percent amount of soil has particles which are finer than this size.
It is given that for a soil to be well graded, value of coefficient of curvature must lie between one and three.
Hence in addition to previous establishment this criterion must be followed in order for a soil to be well graded.
If any of these conditions are not met the soil will be classified as poorly graded.
We can get much information from the grain size distribution curve by simply looking at it.
1. like we discussed already, we can estimate the gradation of the soil. Whether the soil is well graded, poorly graded, gap graded or uniformly graded.
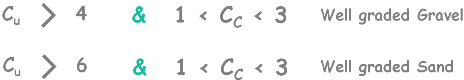
2 using the curve we can differentiate between a coarse grained and a fine grained soil. If more than 50% of the soil material has particle sizes greater than 0.075 mm that soil is called a coarse grained soil. Similarly if more than 50% of the soil material has particle sizes less than 0.075 mm that soil is fine grained soil.
In the curve find particle size for 50% of percentage finer.
If the size falls in coarse grained category then obviously more than 50% of the material is coarse. Hence soil is coarse grained.
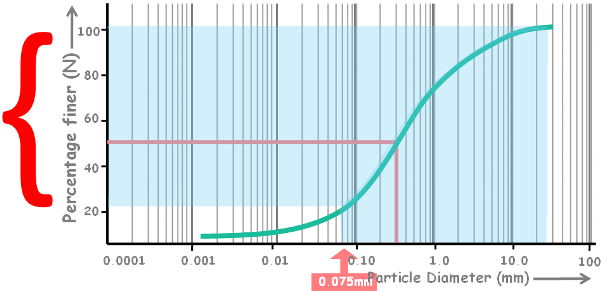
And if that diameter falls in fine grained category then certainly more than 50% of the material is fine, classifying the soil as fine grained soil.
3. We can define the type of soil by curve’s shape and position.
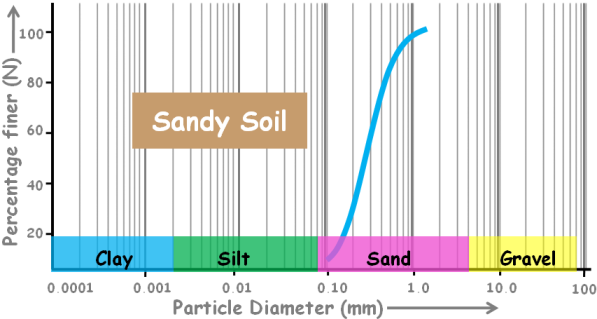
For example: this curve falls inside only in sand region, hence this soil is definitely sand soil.
Now this curve falls in gravel and sand region. So this is gravel sand soil.

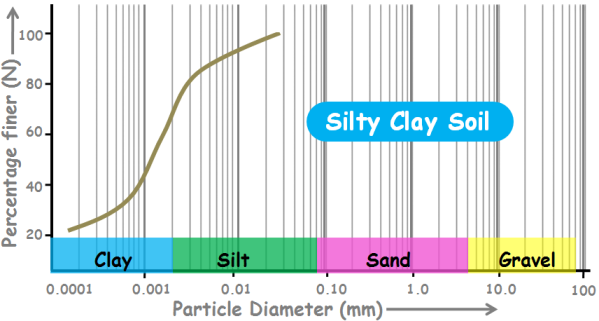
And this curve falls in silt and clay region. So this is silty clay soil.
4. we can determine the range of the grain size distribution of a soil. In this curve soil contains particle from this range. And we can see that this soil does not have any clay content.
5. with this particle size distribution curve we can get the percentage amounts of gravel, sand, silt and clays present in the soil.