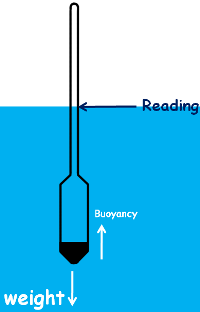
 Hydrometer is an instrument used to measure the relative density of liquids based on the concept of buoyancy. Relative density means density of a substance relative to the density of reference substance. That is, it is the ratio the density of the substance to the density of the reference substance.
The hydrometer we use in our experiment is calibrated to give the relative density values of any liquid relative to the density of water.
And when relative density is expressed relative to water it is usually called specific gravity.
 So in our case we can say our hydrometer measures the specific gravity of the liquid.
Hydrometer consists of a sealed hollow glass tube with a narrow stem which has graduations for measurement. Readings on the tube increase downwards and decrease upwards. It also has a wider bottom portion for buoyancy which contains a material called ballast such as lead or mercury for stability.
We use this instrument for the particle size analysis of fine grained soils.
Particle size analysis is the method of separation of any soil sample into different fractions based on their particles sizes.
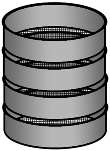 Soils having particle size greater than 75 micron are analyzed by Sieve analysis method using sieves of different sizes.
Soils having particles of size smaller than 75 micron cannot be sieved because smaller particles carry charges on their surface and have the tendency to stick to the sieve surfaces and with each other including other particles.
So to analyze soils containing these particles we use the method sedimentation analysis. This method is based on the Stokes law.
We discussed the theory of sedimentation, its limitations and method of preparation of soil suspension.
In sedimentation analysis we take observation by two methods:
1. Pipette method
2. Hydrometer method.
In sedimentation analysis we learned this equation.

It tells us that in a soil suspension a particle of diameter D will settle to the depth of He in time t.
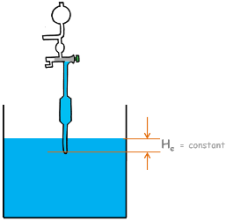
In pipette method of taking observation this He depth is constant and is the depth at which we take all the observations by taking out a small sample.
But in hydrometer method this effective depth He is not constant. Because the depth at which hydrometer takes its readings keeps on changing with time.
 Casagrande has shown that hydrometer gives the value of specific gravity at the center of its bulb.
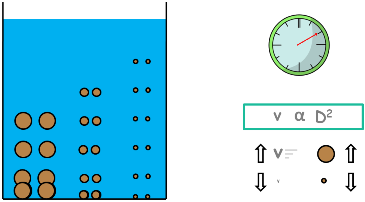
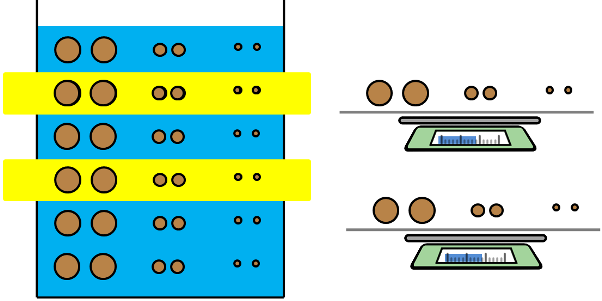
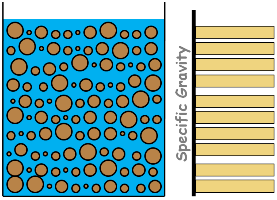 For this experiment we prepare exactly 1000 ml soil sample as described in the sedimentation theory. At the beginning of the sedimentation, being a homogenous soil suspension, particles of different sizes are uniformly distributed throughout the soil suspension. Hence weight per unit volume of the suspension is same at all depths.
Result: specific gravity of suspension is uniform at all depths.
Let’s show fewer particles here.
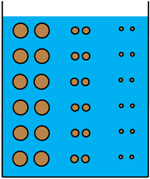
Now as time proceeds, particles start settling down. And according to the other equation large particles settles with greater speed than small particles do. So at a certain depth we will find different concentrations of different particles at different times. This results in non-uniform specific gravity of suspension at different depths.
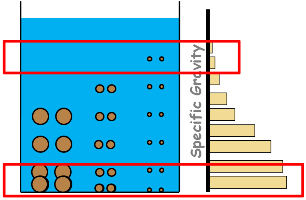
The lower layers of the suspension have higher specific gravity than that of upper layers.

With time few particles settle to the bottom leaving the suspension with lesser amount of soil particles, which makes the suspension lighter or less dense. That is its density and specific gravity decreases. Hence in equilibrium condition of hydrometer, now suspension provides lesser buoyant force to the hydrometer. That means, hydrometer’s weight being constant and buoyant force decreasing, hydrometer starts settling down. And with it changes its readings.
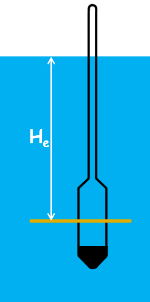 Then how do we measure the depth at which hydrometer is taking the reading.
For that, we need to calibrate the hydrometer. That means we need to establish the relationship between effective depth He which is the depth at which the hydrometer is measuring the specific gravity of the suspension and the hydrometer readings we observe.
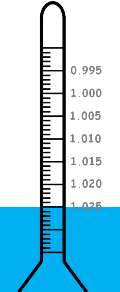 Readings on the hydrometer stem gives directly the specific gravity value of the liquid at the center of the bulb. But we record hydrometer readings by subtracting 1 from them and multiply that by 1000 and represent them as Rh.
Rh = (Hydrometer Reading – 1) x 1000
For example if we notice the reading 1.025 on the scale then we will note hydrometer reading as 25.
Rh = (1.025 – 1) x 1000
Rh = 25
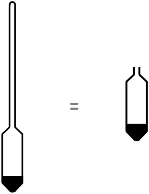 Now before determining the effective depth let us measure the volume of the hydrometer. We will need it for further calculations. Here keep in mind that we neglect the volume of the hydrometer neck and only consider the volume of the bulb. That means we assume that hydrometer volume is equal to its bulb volume.
For volume determination we take a graduated cylindrical vessel and fill it partially with water. Now we immerse the hydrometer into it and we notice the rise of water. The volume rise in the vessel is noted down as VH and that’s the volume of the hydrometer.
Now we determine the effective depth He
Imagine a jar filled with some liquid. Let’s say that hydrometer is going to measure the specific gravity of this liquid at the layer AA inside the liquid. The depth of this layer from the free surface is called effective depth He. Also mark the free surface as BB.

Now when we insert the hydrometer into the liquid, these layers rises to AA’ and BB’.
Hydrometer is still taking the reading at the layer AA but that particular layer has risen up to the AA’.
To determine this rise see that hydrometer is submerged only half up to this layer, so only half of the hydrometer’s volume is responsible for the rise of this AA layer.
Let’s say the cross-sectional area of the jar is capital A. so rise of the layer AA will be half the volume of the hydrometer divided by the cross-sectional area of the jar.
Now to determine the rise of the top layer BB, notice hydrometer’s bulb is fully submerged below this layer and hence whole hydrometer’s volume will be responsible for the rise of this layer. So rise will be volume of hydrometer divided by the jar cross-sectional area.
Now we can calculate effective depth as height of hydrometer’s submerged neck H plus half height of the hydrometer bulb h/2 minus rise in the layer BB plus rise in the layer AA.
![]()
And after simplification it can be written as this.
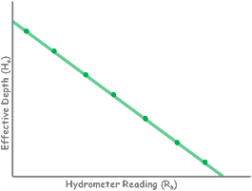
![]()
Now we determine the values of effective depth corresponding to each reading mark Rh on the hydrometer. Plot these points on a graph and draw the curve by connecting the dots.
This curve, which is actually a straight line, is called calibration curve of hydrometer.
Now with this curve we can determine the effective depth for any reading of the hydrometer.
Our aim with this experiment is to have particle size distribution so we need to calculate percentage finer than different particle sizes. [ Go Slow ]
So let’s start the experiment. We prepare exactly 1000 ml soil suspension.
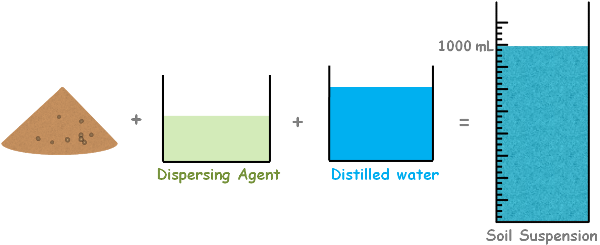
Keep in mind that we also used the dispersing agent in the preparation of this suspension. A rubber bung is used to close the mouth of the jar and turn it upside down and back a few times so as to ensure that soil suspension becomes homogenous. After complete mixing the jar is placed and a stopwatch is started. Then we insert the hydrometer in the suspension to note down our first reading which is taken after 30 seconds.
Further readings are taken after 1 minute, 2 minutes and 4 minutes.
After taking these readings hydrometer is taken out from the jar and floated in to another cylinder containing distilled water.
We take more readings after 8 minutes, 15 minutes, 30 minutes and 1, 2, 4, 8 and 24 hours from the beginning of the sedimentation.
For all those readings hydrometer is inserted about 20 seconds before the reading is to be taken with as much care as possible not to disturb the suspension.
And it is taken out as soon as reading is taken with as little disturbance as possible. It is then floated into the distilled water again.
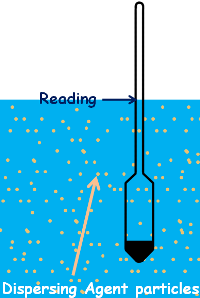
Now if we notice, the reading we noted is not the correct specific gravity of soil suspension as this suspension also contains particles of dispersing agent.
Also by the effect of meniscus we happened to take the false reading.
There is another problem that hydrometer is calibrated at a particular temperature and the temperature at which we are experimenting may be different.
Hence to rectify these mis-readings we apply few corrections to the readings we take.
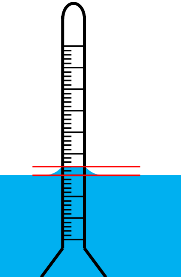 First one is Meniscus Correction:
We know liquid’s top surface get curved near any other surface because of the effect of surface tension. This is called meniscus.
In our case the actual reading we should be taking is at this surface. But due to meniscus effect and soil suspension being opaque we ended up taking the false reading. This false reading is actually lesser than the actual one, because on hydrometer, readings decrease upwards.
In our case we will always take the lower reading than the actual hence meniscus correction will always be positive. Meniscus correction is denoted as capital Cm.
We can determine this meniscus correction by taking the reading at the top and bottom of meniscus in distilled water cylinder, as we can see both the meniscus in the distilled water.
Second one is Temperature Correction:
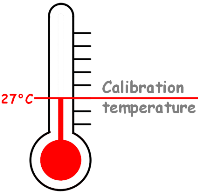
 Hydrometers are generally calibrated at 27°C temperature, so if the temperature of the suspension is different from 27C, we need to apply the temperature correction to the reading we take.
Generally if temperature of any liquid rises, its density decreases which causes liquid to provide lesser buoyant force to the hydrometer. Consequently hydrometer settles more to give us the lesser reading. Remember: hydrometer readings decrease upwards. So in this case temperature correction will be positive.
And on the other hand if the test temperature is lower than 27C the liquid will be denser. Buoyant force will increase and hence hydrometer will go less deep than it should. So reading will be higher than the actual and in this case temperature correction will be negative.
Hence temperature correction, which is denoted by capital Ct, can be both positive and negative. This temperature correction chart is provided by the manufacturer.
 Third correction is Dispersing Agent Correction:
When we add dispersing agent to the soil suspension, its particles increase the density of the suspension which also causes hydrometer to settle less and provide higher reading. Therefore dispersing agent correction will always be negative and is denoted by capital C d.
We can determine dispersing agent correction by taking the hydrometer reading in distilled water and taking the reading after adding the equal amount of dispersing agent we are going to use in our actual soil suspension but keeping the liquids volume same. The difference between the readings is the dispersing agent correction.
Hence the corrected hydrometer reading capital R after applying all the corrections can be given as this.
R = Rh + Cm ± Ct – Cd
Now let’s establish the relationship between hydrometer reading and percentage finer.
We know percentage finer as weight of soil sample containing particles of size smaller than D divided by weight of the total soil sample with all the particles present in suspension.

At the beginning of the sedimentation, because of suspension being homogenous, particles of all sizes present at all the depths.4
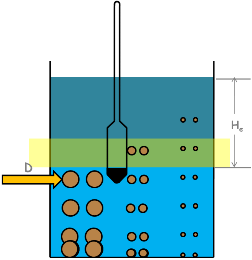
But as time proceed particles start settling down. Bigger particles settle faster than the smaller particles.
Let’s assume after time t when we dip hydrometer into the suspension it gives specific gravity reading on this layer, and in this time t this particle of size, say, D has traveled up to this depth. And we know that this depth is effective depth He.
If we are able to determine the weight of solids in this layer at the beginning when all the particles of all the sizes present at this depth and after time t when particle of size D just settles below this layer then we will be able to calculate the percentage finer than D.

Let’s write this equation as equation number one. And numerator as 1A and denominator as 1B.
For 1B, at time t = 0 suspension is homogenous and if we take weight of solids that is weight of soil particles of any two layers of the suspension, it will be same. So weight of soil particles per ml in any layer will be total weight of soil sample initially taken divided by the total volume of the soil suspension.

We are calculating all the weight of solids as per ml of suspension as we don’t know what actual volume of that layer would be where hydrometer will be taking the readings.

Now for 1A
After time t particles will be in this position and hydrometer takes reading at this layer. So let’s say volume of this layer is Vlayer.
Weight of soil particles per ml in this layer will be Wsolids in layer divided by Vlayer.

We estimate weight of solids present at this layer using the hydrometer reading.
Let’s imagine this hydrometer reading at that layer after application of all the corrections becomes R. And we represent hydrometer reading as this.

It is the specific gravity value of the suspension at this layer. Now we know that specific gravity is equal to unit weight of suspension at this layer (Ylayer) to the unit weight of water. Also gamma layer can be written as weight of suspension in this layer divided by volume of this layer (Vlayer).

Weight of this layer will be weight of water and weight soil particles present in this layer.

Lets re-write the equation and represent water and solids of this layer as occupying certain volume in this layer.

From this we can write weight of water present in this layer as unit weight of water multiplied by volume of water present in this layer.
Here we can write volume of water as volume of layer minus volume of solids present in that layer.
Again on simplifying the equation…

Now we can write volume of solids as (Ws/ GYw) using simple specific gravity formula.

Simplify the equation a little.

solve it for weight of solids per volume of layer.


Here we are going to take all our measurements in gram and centimeters, so unit weight of water gamma w will be equal to 1 gram per centimeter cube.
Now we have calculated what we needed to determine the percentage finer.
Let’s substitute that and rearrange it.


Remember that we prepared our suspension of volume 1000 ml.

So finally we get the value of the percentage finer than particle of size D present in a soil sample using hydrometer.

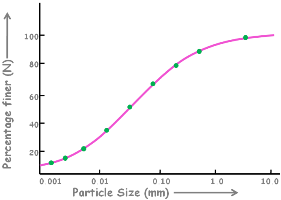
As the time proceeds we take hydrometer readings at different times and we get different values of specific gravity of suspension. Consequently different values of the percentage finer.
Using all these values we plot a graph between percentage finer than D and the diameter of the particle D.


