The stress history of soil is a critical concept that plays a significant role in understanding the behaviour of soils under various conditions. It refers to the record of stresses that a particular soil deposit has experienced over time, including both natural and man-induced stresses.

Understanding the stress history is very important because it can significantly influence the soil’s physical properties, such as its shear strength, compressibility, and permeability. These properties, in turn, can impact the design, stability, and performance of foundations, embankments, retaining structures, and other geotechnical constructions.

The stress history is often quantified using the concept of overconsolidation ratio (OCR), which compares the maximum past stress on the soil, called preconsolidation pressure, to the current effective stress.

Soils can be classified as normally consolidated or overconsolidated based on their stress history and OCR. We have discussed these in our previous post.
In this post we will continue our analysis of the data obtained from the consolidometer test, part of which we have already discussed in our previous post. We will focus on understanding the behaviour of soil by examining the void ratio and effective stress curve, which depicts the stress history of our soil sample.
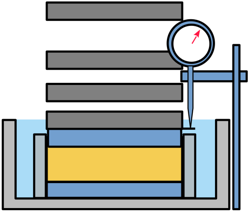
In the Consolidometer Test we loaded a soil sample in steps and then unloaded it in the same way. We plotted the curve between void ratio and effective stress on log scale.
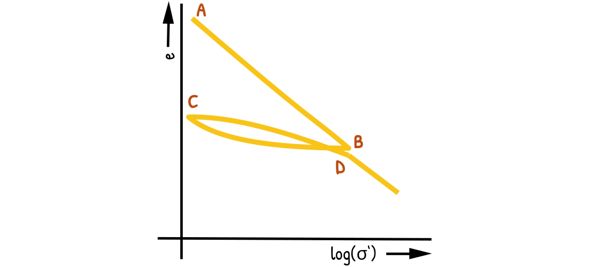
For our soil sample that has never been subjected to any compressive loads in its history, we obtained a straight line by loading it for the first time. This line is known as the Virgin Compression Curve. In this part of the curve soil is in normally consolidated state as the current stress is the maximum that it has ever experienced.
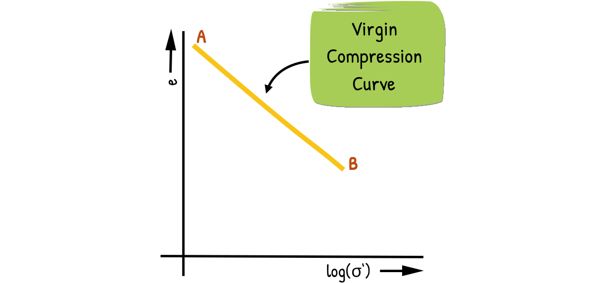
Lets denote this compression curve as AB. We did not plot the portion of the curve when the soil sample was unloaded. So when the sample reaches the equilibrium under the final load, at point B which represents the maximum stress applied during the test, we remove the load from the sample and allow it to swell under unloaded conditions. After allowing the soil sample to swell and measuring the corresponding void ratio and effective stress, a curve is obtained that is concave upward.
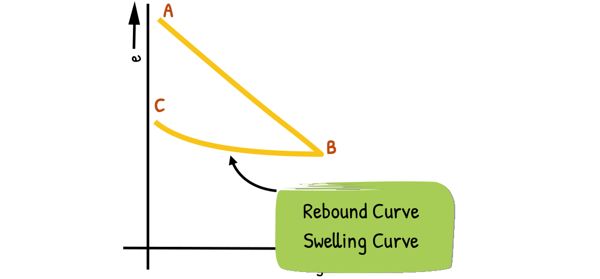
This part of the curve is known as the Rebound Curve or Swelling Curve.

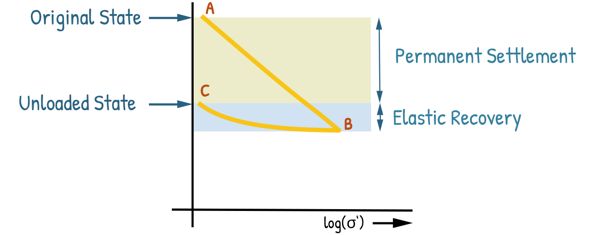
It’s important to note that soil sample could not fully recover its original state and void ratio that was at the beginning of the test. This signifies that some amount of permanent settlement has occurred in soil due to loading. The portion of deformation that is recovered after unloading is attributed to the elastic recovery of the soil structure.
Lets mark the final point on the rebound curve as C. Now, if we reload the soil sample that has swelled to point C, this process creates a new curve and as we increase the load, the curvature of the curve reverses direction. As the load approaches the maximum load that was experienced by the sample at point B, the curve merges with the original compression curve AB at point D. This new curve has concavity downward and is called the Recompression Curve.
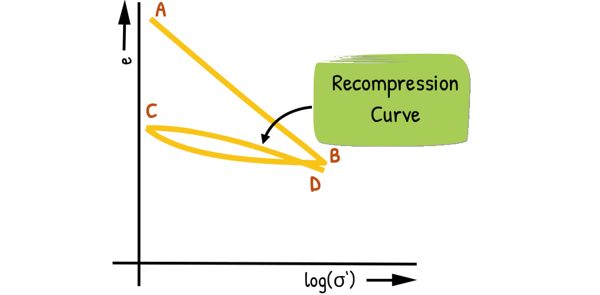
However, we observe that the reloaded specimen has a slightly lower void ratio at point D than it did at point B during the initial compression for the same load. When further load is applied to the sample, the curve merges smoothly into the straight line and continues as an extension of the first loading curve AB.
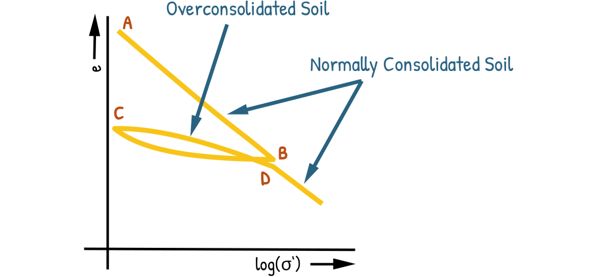
An interesting thing we can observe from this experiment is that a plot of void ratio vs. lagarithm of effective stress is always a straight line for a normally consolidated clay. However, for overconsolidated clay, the plot almost always exhibits a convex curvature upward. This pattern has been confirmed by lots of experiments conducted on different soil samples.
We should also note that sometimes overconsolidated soil is also called Preconsolidated Soil. Now there are too many similar terms in this concept. Please understand them carefully and don’t get confused one by the other.
We should notice that the curve we drew started with a straight line but in reality it, begins with a flatter initial portion that transitions into the steeper virgin compression curve. This flatter portion also represents the recompression curve.
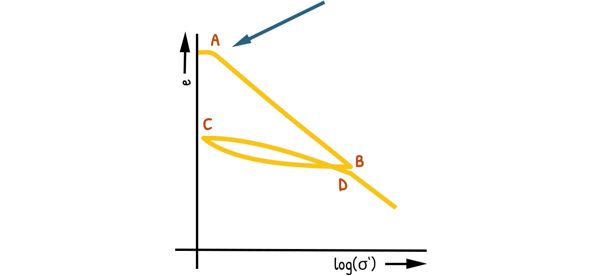
This is because, no matter how careful we are, taking a soil sample from the field inevitably introduces some disturbance to the soil structure. Also this flatter portion in the curve may be introduced because the soil may have experienced some degree of stress in its geological history, even if it has not been subjected to any significant man-made loads.
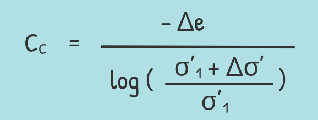
In our previous post we defined the slope of the linear portion of the curve as Compression index of soil (CC). Similarly we can also define few more coefficients for the unloading and reloading portions of the curve.
We can define Expansion Index or Swelling index Ce as the slope of the Rebound curve as this.
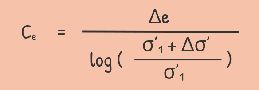
Since we can notice both the equation have Δe and the change in void ratio during swelling is smaller when we compare the change in void ratio during compression for the same load change, it is evident that Swelling Index is much smaller than Compression Index. This makes sense, as we know that the void ratio does not fully recover to its original value during swelling that it experiences during compression under the same amount of pressure.
Also, we can define Recompression Index as the slope of the recompression curve which is obtained when the soil is reloaded after it has already been loaded and unloaded.
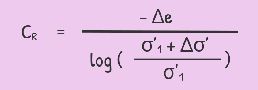
by looking at the graph we can also say Recompression Index is much smaller than the Compression Index Cc.
There is a method, a graphical method to find out the maximum load that a soil has previously been subjected to called, preconsolidation Stress. That we may discuss in the next post.
If this made things clearer, here is the link to the formula sheet where all the important formulas are in one place.