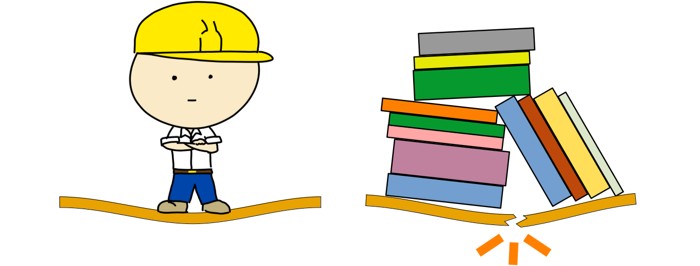
Someone stands on a wooden plank and their weight causes it to bend slightly. Or you might have noticed an old bookshelf loaded with tons of books, visibly sagging in the middle.
In both cases, the plank and the shelf seem to be fighting against the load they’ve been imposed to. And it’s pretty clear that if the load keeps increasing, they’ll either start cracking… or break completely.
But then, we have also seen huge, heavy bridges carrying tons of vehicles every day — and they don’t seem to sag at all! Or a concrete floor in a big building carrying dozens of people without the slightest bend.

So what secret does engineers use that keeps these massive structures functional for years without sagging or breaking. Well, they not only know how to safe guard a structure but they also know which point of the structure is the weakest and where the first crack might appear. They also know how much load it can carry safely. How do they know all this?
The truth is — even though a beam looks solid and still, there’s a lot going on inside it whenever it carries a load.
The beam actually generates hidden internal forces that fight back against the applied load.
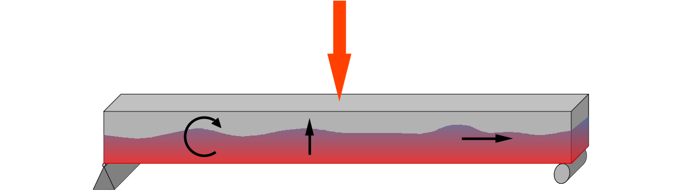
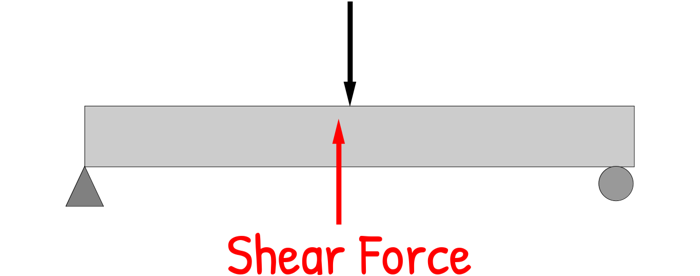
When load is applied to a beam or a wooden block, it tries to slice the beam. When a load pushes down on the beam, one part of the beam wants to move downward with the load, while the rest of the beam tries to hold it in place. This creates a kind of ‘sliding’ or ‘tearing’ action inside the beam, as if the layers are trying to slip past each other. The beam resists this sliding action, and that resistance is what we call Shear Force.
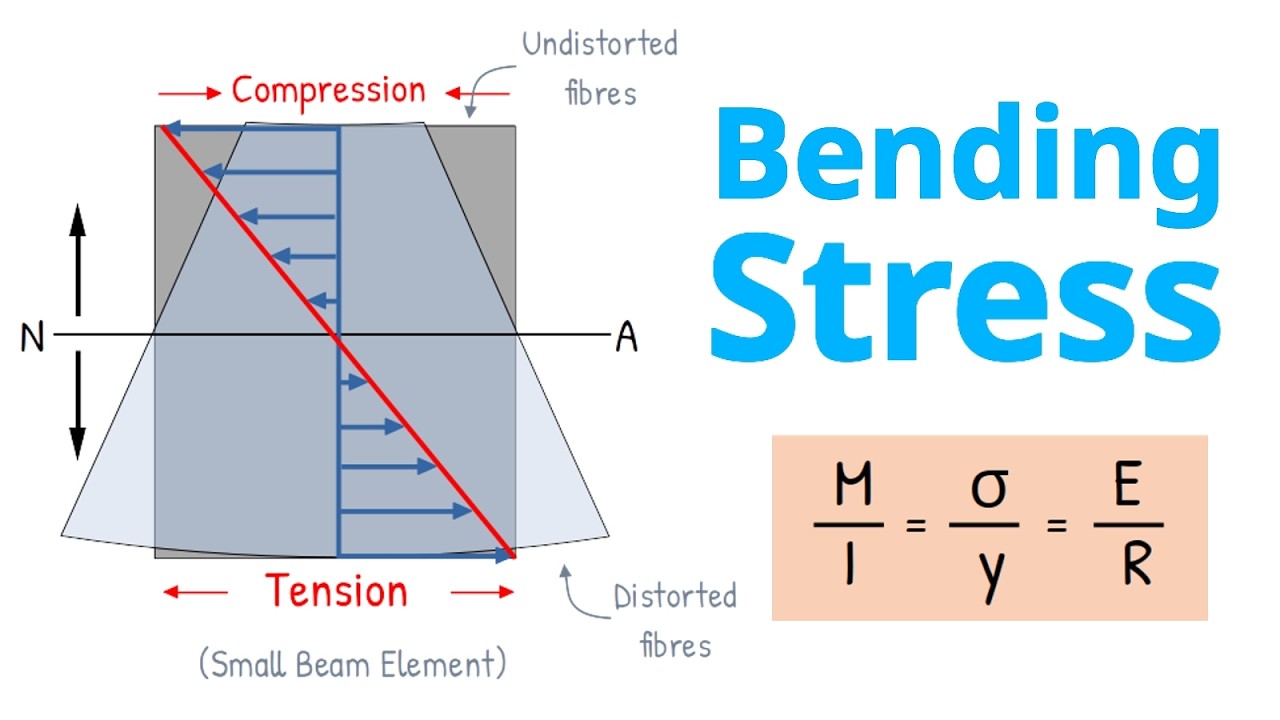
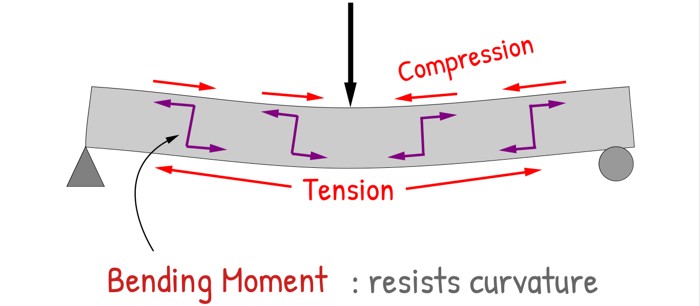
But that’s not all. The load also tries to sag it. This sagging compresses the beam at top while stretches at bottom. So beam resists this compression and tension by generating the Moment, that is called Bending Moment. Bending moment is all about resisting curvature.
Now here’s the critical part: At any section in the beam, if force shearing the beam exceeds the internal resisting force, beam breaks. Also if sagging moment exceeds internal resisting moment, the beam cracks and fails.
So it is critical to determine the shear force and bending moment generated in the beam at any section. Once we know where the shear force is maximum or the bending moment is maximum, we instantly know the most vulnerable spot — the place where the beam would crack or break first.
And once we identify that weak location, we can strengthen it: maybe extra reinforcement, maybe a bigger section, maybe reducing the load. That’s how safe structures are designed.
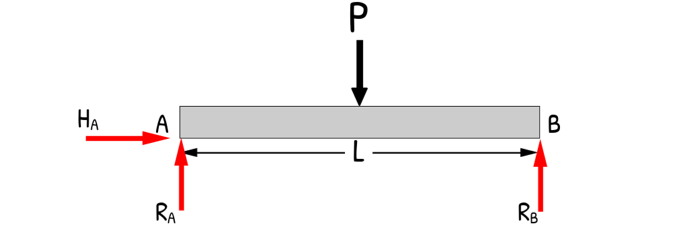
So our first job is to determine the shear force and bending moment. We’ll start with the simplest case: a simply supported beam of length L with a point load P in the middle.
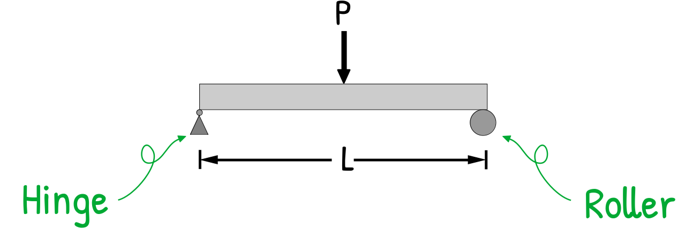
A simply supported beam is supported by a hinge on one end and a roller on the other.
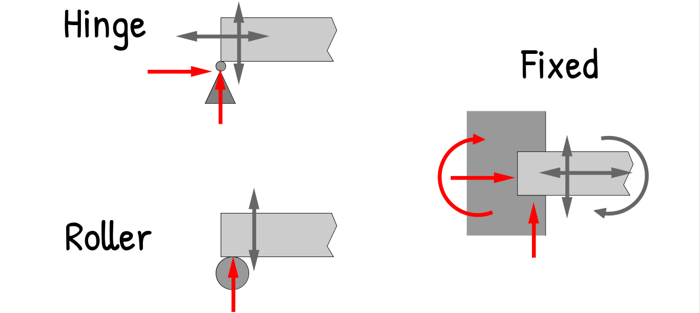
All supports generate reactions. These reactions appear only in the directions where the structure is prevented from moving. If a direction is free, no reaction can develop in that direction.
A Hinge stops both vertical and horizontal movement, so it provides two reactions.
A Roller stops only vertical movement, so it provides just one vertical reaction.
There’s also a Fixed support, which stops movement in every direction and also prevents rotation — so it provides three reactions: a horizontal force, a vertical force, and a moment.
Now, back to our problem.
To analyze the beam, we need to figure out the support reactions first. After that, we’ll determine shear force and bending moment generated in the beam at all points.
For support reactions we use three equilibrium conditions.
Rule 1: Vertical Balance : The sum of all vertical forces must be zero (ΣFy = 0),
Rule 2: Horizontal Balance : The sum of all horizontal forces must be zero (ΣFx = 0), and
Rule 3: No Spinning : The sum of all moments must be zero (ΣM = 0).
These three equilibrium equations allow us to find three unknown reaction components even if there is a complex loading with many vertical or angled point loads, udl or uvls.
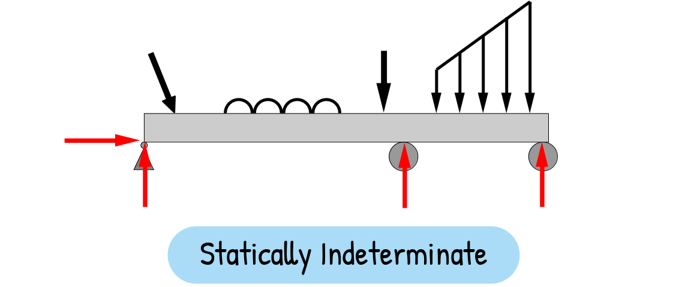
Important thing is, we only have three equations, so we can only solve three unknowns. If a structure has more than three unknowns, we cannot solve all of them using only equilibrium equations. Such structures are called Statically Indeterminate.
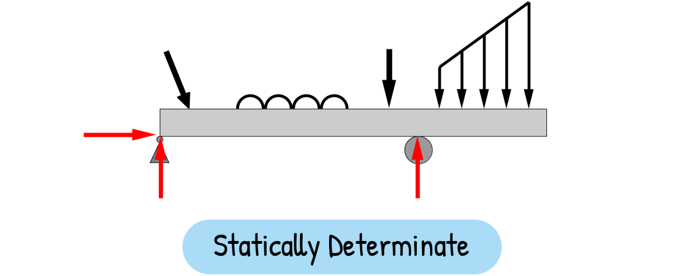
If all unknown reactions can be found using only these three equations, then the structure is Statically Determinate.
We use equilibrium conditions when body is either at rest or moving with a constant velocity. And since our beam is just sitting there holding the load, these rules apply perfectly.
Now, back to our beam. First let’s draw the Free Body Diagram (FBD) of the beam. We remove the supports and replace them with the reactions they generate. Let’s call the beam AB, with vertical reactions RA and RB, and a horizontal reaction HA at support A.
Rule 1: ΣFy = 0
Taking upward direction as positive,
RA + RB – P = 0
RA + RB = P … (1)
Rule 2: ΣFx = 0
Since we only have the hinge reaction HA and no other side-to-side forces,
HA = 0 … (2)
Rule 3: ΣM = 0
We can choose any point on the beam and calculate the moment generated by each force from that point. Since beam is in equilibrium sum of all moments will be zero.
If we remember, a moment is simply force multiplied by perpendicular distance from the point of rotation.
Here, let’s pick Point A — the hinge — because that makes RA and HA disappear from the equation, since their distance is zero from this point. Let’s take clock-wise direction as positive.
P.L/2 – RB.L = 0
RB = P/2
By substituting this in our equation (1), we get
RA = P/2
Once the support reactions are known, we can finally look inside the beam.
To find the shear force and bending moment at any point, we use the Method of Sections. Meaning, we slice the beam wherever we wish to determine the generated internal forces.
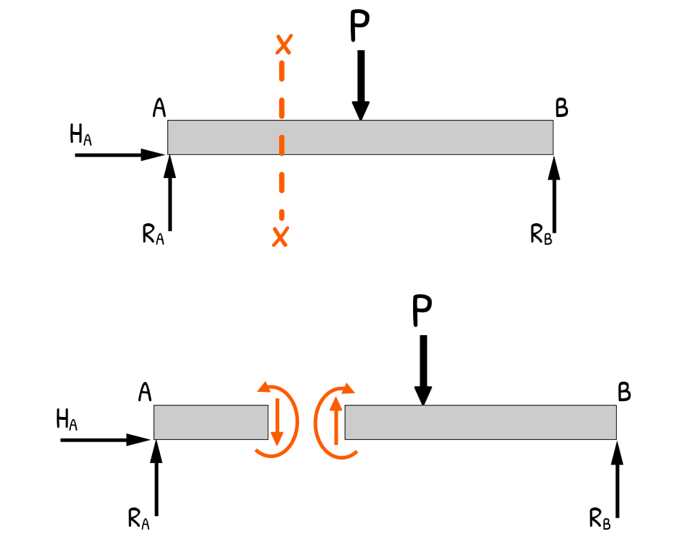
Why we do that? Because internal forces are invisible, and taking a cut exposes them — just like cutting a fruit reveals its inside.
Usually the shear force and bending moment change their value and pattern whenever there is a load, udl or a moment is acting. So, we always cut the beam just before and after any such change in loading.
By cutting, we have two sections of the beam. Both the sections at the point of slice now carry both shear force and bending moment as equal but opposite in direction.
Here, we can work with either of the sections. And for me it has always been much clearer and less confusing to work with only one section and that too with the left one.
Now, one important thing here is the sign convention. Many different books and teachers use different conventions. It is best to choose whatever your professor uses and stick with that — because while adopting a different convention doesn’t change the results and actual stress in the beam, but it will flip your diagrams. which can lead to miscommunication.
To maintain clarity and align with standard design practice we use this sign convention.
Shear force that causes a clockwise rotation of the beam segment on which it acts is considered as positive.
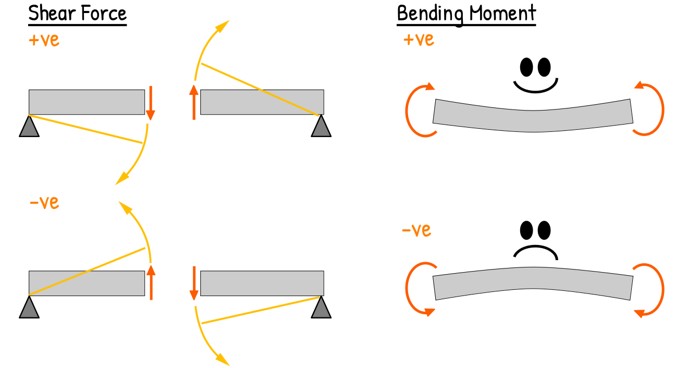
The opposite—Shear force that causes a counter-clockwise rotation of the beam segment is considered as negative.
For bending moment, a moment that makes the beam section sag into a “happy face” shape — is taken as positive.
Similarly, a hogging moment — the “sad face” — is negative.
Now, we look at our beam again. We move from left to right. Since HA came out as zero, we can remove it. Also replace the values of reaction forces that we have already determined.
Now, the first force we encounter is the support reaction at A. So we cut the beam just after the support, at a small distance x from A, and draw the free-body diagram for the left portion.
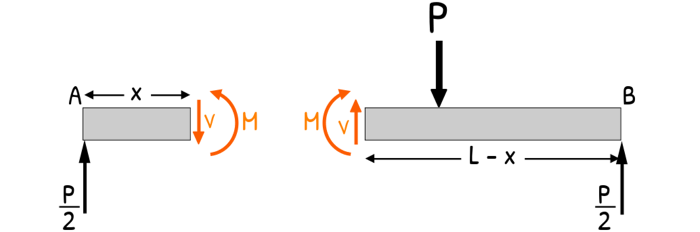
On this left section, there is one support reaction acting upwards at A, Internal resistance of shear force V and bending moment M at the cut.
The right section would have equal and opposite internal forces, but since we are going to analyze the left section only, forget the right one.
Now it is just a simple equilibrium conditions problem only. We have to apply those simple equilibrium conditions to this body.
ΣFx = 0
ΣFy = 0
ΣM = 0
No horizontal force is seen here so we only have to apply two of them.
ΣFy = 0
ΣM = 0
So, first balancing vertical forces (ΣFy = 0), taking upward as positive. we get this :
P/2 – V = 0
V = P/2 …(a)
We can see, this shear force came out constant and positive, and it’ll remain so until any other force acts on the beam.
Now for the Bending Moment (ΣM = 0)!
Let’s take moment about the point where we cut the beam. We are keeping the clockwise direction as positive.
(P/2)x – M = 0
M = (P/2)x …(b)
We can see, this is an equation of a linear curve meaning the bending moment M increases linearly as the value of x increases from the support toward the middle of the beam.
Now we move to right and here we have a force at midspan. Here things will change. So, let’s make another cut just after this load, at a distance x from support A, where x is greater than L/2.
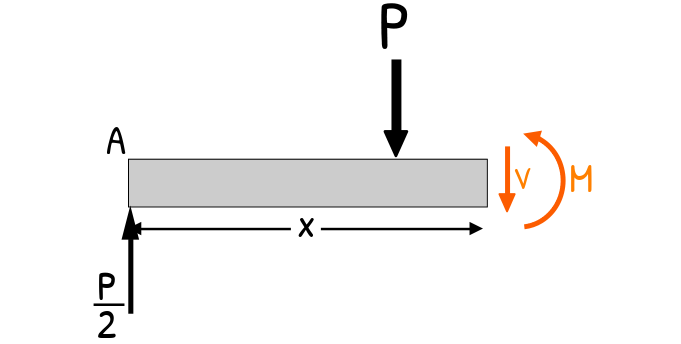
Again, we draw the free-body diagram for this left portion and begin solving the both equilibrium equation.
Balancing vertical forces (ΣFy = 0) gives us:
P/2 – P – V = 0
V = – P/2
The shear force came out negative. It only tells us that after the point load, the internal shear force switches direction. The sign is just a reminder that the beam’s internal resisting action has flipped.
Now the moment equation (ΣM = 0).
We take the moment about the cut point x.
(P/2)x – P(x-L/2) – M = 0
M = -p/2x + pL/2
This is still a straight line, but it has a negative slope!
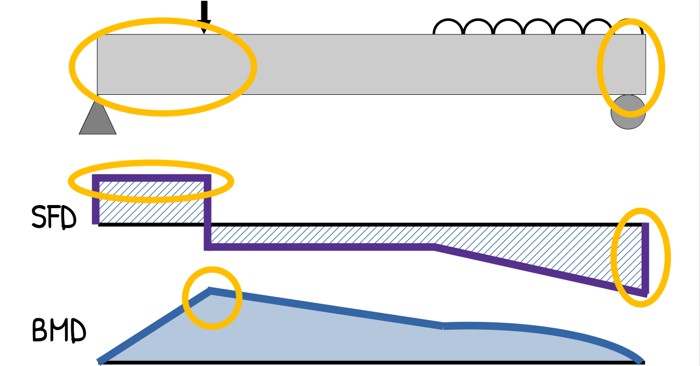
Now that we have analyzed the whole beam and our equations for shear force and bending moment is ready, it’s time to translate these equations into the visual language of the Shear Force Diagram (SFD) and the Bending Moment Diagram (BMD).
(SFD and BMD are after these explanations of how to draw them)
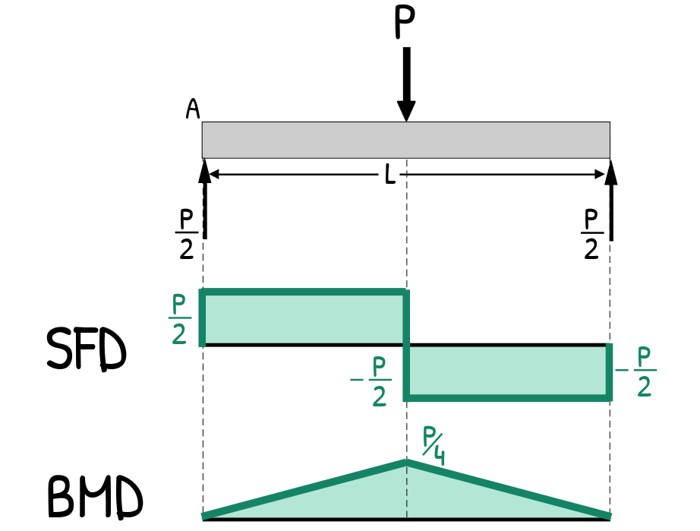
We start from the left most point. At x = 0, Before any loads act, the shear is 0 so graph starts at zero.
Now from A up to the point load — we found that the shear force is +P/2. So in the SFD, the graph jumps from zero and we draw a horizontal line at +P/2 from x = 0 all the way to x = L/2.
Then from the point load to the right support — we calculated that the shear force drops to –P/2, and remains constant.
So graph drops from +P/2 to – P/2 and we draw another straight horizontal line at –P/2 all the way to the end of the beam at x = L.
Finally, at the right support, shear force becomes zero again — just as it should for equilibrium.
Now let’s draw the bending moment diagram.
In the first section, the bending moment equation is :
M = (P/2).x
This is a straight line. At x = 0 bending moment value is 0. and at x = L/2
M = (P/2)⋅(L/2) = PL/4
So we draw a sloping straight line from zero at A to PL/4 at the point load.
After the point load, the bending moment equation is:
M = -(p/2)x + (pL/2)
by putting the value of x = L/2 we get the value exactly the same as pL/4. Hence, this line starts exactly from the previous peak.
Then, by putting x = L we get the value as zero.
Since the equation is also linear, we draw a straight line going down from PL/4 at midspan back to 0 at support B.
And with this, our Shear Force Diagram (SFD) and Bending Moment Diagram (BMD) are complete.
But, how exactly these diagrams help engineers?
These diagrams tell us how the beam is internally reacting to the load — something we cannot see from the outside. They show exactly where the beam is most stressed.
From the shear force diagram, we notice that the shear value jumps whenever we pass over a load or a reaction. Loads act suddenly, so shear changes suddenly. If the beam had multiple loads, each jump would indicate a location where shear suddenly increases or decreases. Also the critical location for shear failure is the point where the shear force value is maximum.
The bending moment diagram is even more important for flexural design. Here, the maximum bending moment PL/4 occurs at the center of the span. This instantly tells the engineer: This is where the beam experiences the greatest tension and compression — so this is where the main reinforcement must be placed.
In real structural design, engineers use these diagrams to:
• Identify maximum shear and bending moment
• Compare these values against the capacity of the beam
• Add steel where needed (main bars for bending, stirrups for shear)
• Increase beam size if required
• Ensure no section experiences unsafe stress
This was the simplest possible case. But now that the core idea is clear — cutting the beam into sections, applying equilibrium, and plotting the internal forces — we can extend the method to much more complex beams.
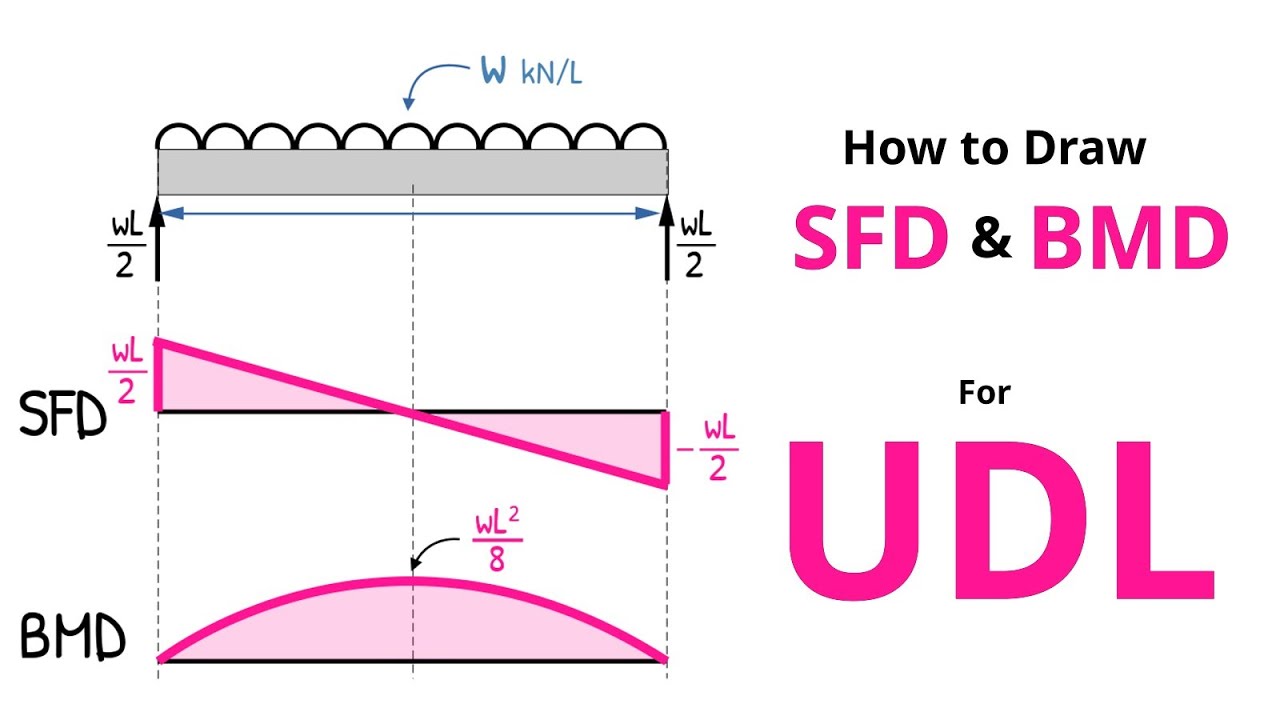
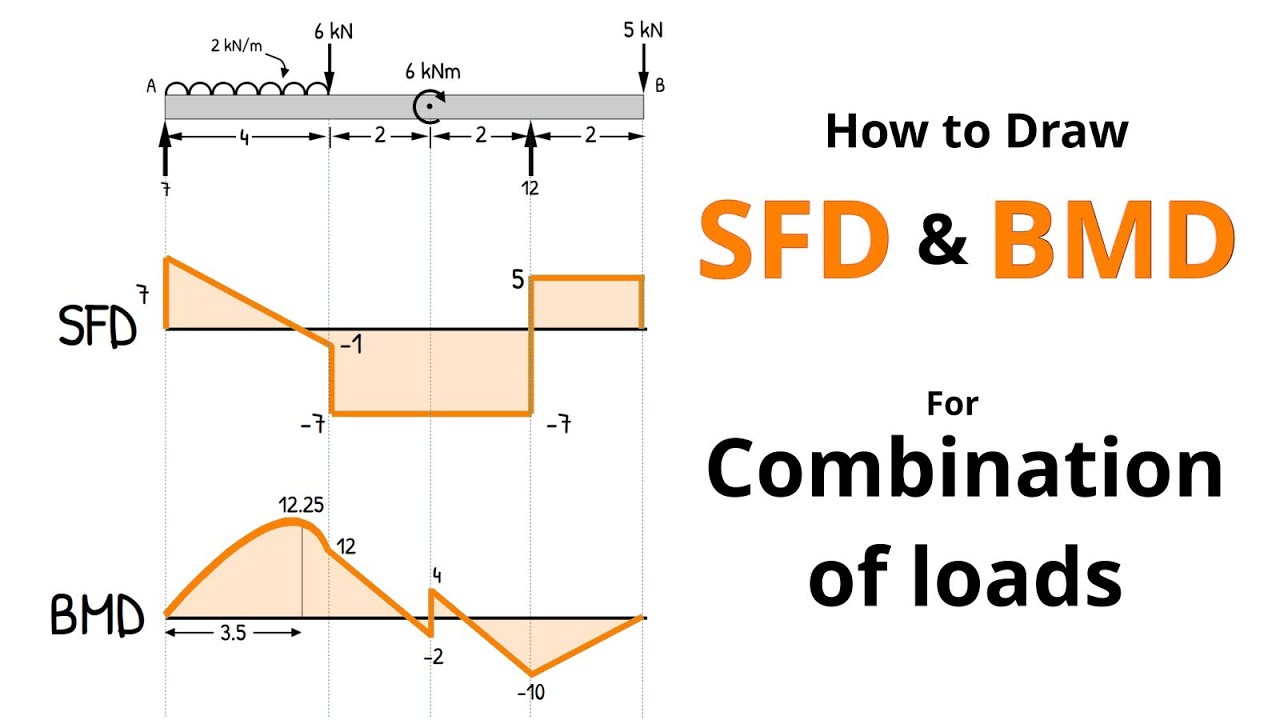
Multiple point loads, UDLs, triangular loads, overhangs, different support combinations — the logic stays exactly the same. Only the equations change.
In the next post, we will take beams with more complicated loading conditions and draw their SFD and BMD step-by-step, exactly like we did here.
Once you understand how to cut a beam and draw these two diagrams, you can analyze almost any structure on Earth — from a wooden bench to a skyscraper.

If you found this helpful, I’ve created a detailed PDF that expands on this understanding further. The PDF covers multiple loading cases (uniformly distributed loads, uniformly varying loads, pure moment case and some more) with step-by-step shear force and bending moment diagrams, explains the relationship between loading and SF and BM, and highlights common exam mistakes. It’s designed to strengthen your fundamentals, and you can purchase it here or by clicking on the image.