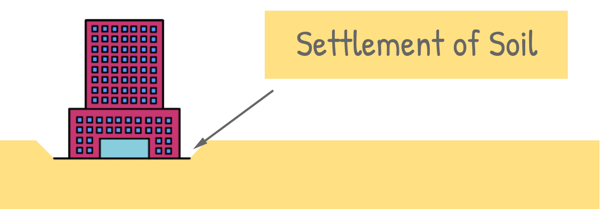
Heavy buildings or structures make the ground compress a little over time due to their weight. This compression of soil is known as Settlement of soil.
Total settlement of the soil has primarily three components.
- Immediate Settlement
- Consolidation Settlement or Primary Consolidation
- Creep Settlement or Secondary Consolidation
The Total Settlement of soil is the sum of all three factors

Consolidation Settlement is the most dominant factor of the total settlement. It refers to the settlement of soil that occurs because applied load causes the rearrangement of soil particles and dissipation of excess pore water pressure in saturated soils. We have learned all this in our previous post.
To estimate the amount of settlement and rate of consolidation we perform consolidation test on soil sample in laboratory. The Consolidation test also helps determine various soil properties of clay relevant to consolidation, such as the permeability, swelling behaviour of soil and coefficient of consolidation.
Though the whole process of this test is more lengthy than what we are going to discuss here in this post, but for the simplicity and that the post doesn’t get too long we divide the it into two or probably more parts.
For this post our objective is to observe the compression of soil with time under one static load. We are going to look at rate of settlement and the time it takes for pore water to drain under pressure.
The test is carried out in a device called an Oedometer or a Consolidometer. This device has two main components: a loading system that applies pressure and a container for the soil sample, known as the consolidation cell.
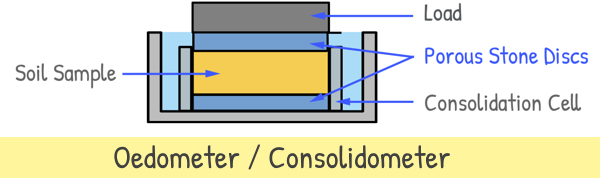
Top and bottom of the sample are equipped with porous stone discs. These discs enable two-way vertical drainage, allowing water to flow freely in and out of the soil. Keep in mind that it is an schematic diagram actual system is a bit different.
The soil sample is carefully placed inside the consolidation cell. Then a load in placed on top of the cell. The soil is allowed to consolidate (settle) until practically no further compression occurs. This ensures all excess water pressure within the pores is entirely dissipated. Typically, the load is maintained for a full day (that is 24 hours).
A dial gauge is used to measure the deformation of the specimen in the vertical direction. The dial gauge readings are recorded at various time intervals after applying the load. Last reading is taken at 24 hours.
We plot the change in dial gauge readings, which represent soil settlement, against time to create a time-settlement curve.
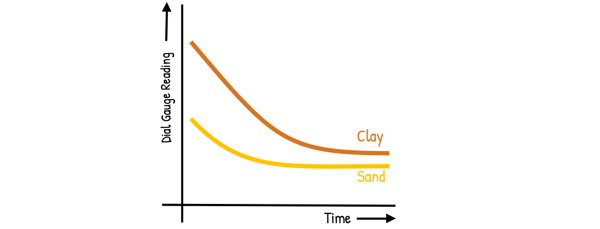
The curve exhibits similar shape for different soils, but the position of the curve can vary significantly due to differences in consolidation rates, as observed in the case of clay and sand.
We can observe a rapid initial decrease in the thickness of the clay sample but it gradually slows down with time. Also that there is practically no change in thickness after 24 hours.
If we draw this curve for sand, we note that sand experiences a very swift reduction in thickness that flattens within minutes. This demonstrates that most of the sand’s compression occurs almost instantly. It is so because of the high permeability of the sand which allows water to escape easily.
This is why structures built on sand experience minimal settlement after construction, as most of the settlement will already have taken place by the time the structure is complete.
Using this graph we determine the Coefficient of Consolidation (CV), which is useful for obtaining the rate of consolidation in the field. Which means it tells us how fast a soil squeezes out water and gets denser under load.
There are two methods of determining the Coefficient of Consolidation using the graph.
1. square root of time method which is also called Square Root Fitting
2. logarithm of time method which is also called Logarithmic Fitting
The square root of time method is typically used for analysing consolidation data in high permeability soils like sands. We use square root of time on one of the axis because these soils settle relatively quickly.
Conversely, the logarithm of time method is better suited for low permeability soils like clays, which consolidate much slower and require a different approach to account for the extended time frame. So we use log scale of time on one of its axis.
We may discuss these approaches in coming our posts but consolidation test has more to offer. We increase loadings on the consolidation cell and obtain more data which can help us determine how much compression of soil is taking place because of the applied load by plotting a graph between void ratio and effective stress. But that is for next post.
Good explanation. Can I get data sheet of it?